
There’s been a recent uptick in foreclosure headlines, but much of the coverage is built to provoke fear rather than offer perspective. The truth behind the numbers paints a much more stable and reassuring picture of today’s housing market.
Before making assumptions based on headlines, it's important to take a step back and consider the full scope of the data.
Yes, foreclosure starts increased by 7% in the first half of 2025. But that doesn’t mean we’re headed for a crash.
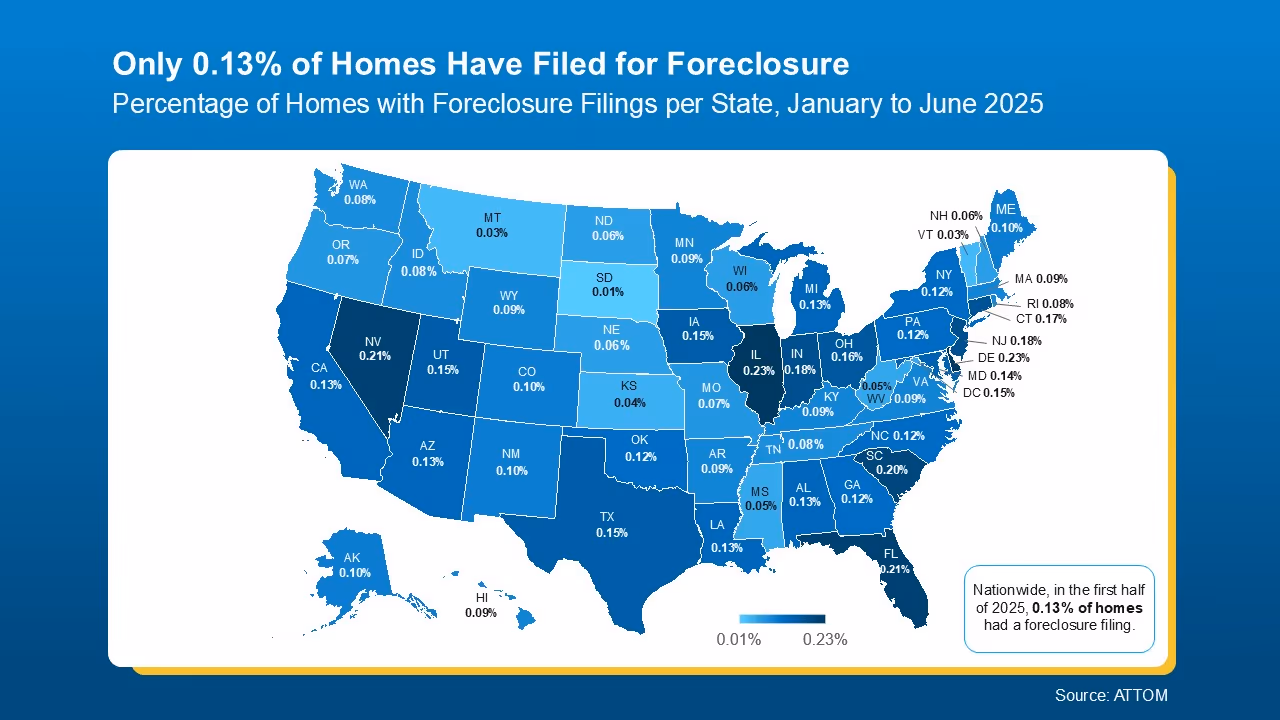
In fact, foreclosure activity today remains far below what we saw during the housing crisis. According to data from ATTOM, only 1 in every 758 homes in the U.S. had a foreclosure filing from January through June of this year. That’s just 0.13% of all residential properties — a fraction of what was happening during the 2008–2010 crash.
By comparison, back in 2010, 1 in every 45 homes faced foreclosure. That difference is significant and underscores how much stronger the market is today.
While national numbers are low, it’s worth noting that foreclosure activity differs by region. Certain markets may be experiencing more filings than others, but that doesn’t indicate a nationwide problem.
Take a look at the foreclosure map below to see how rates vary across different parts of the country — and how most areas are still showing very healthy numbers.
To understand why today’s market is different, it helps to look back.
The last crash was triggered by risky lending practices that left many homeowners with mortgages they couldn’t afford. When home values dropped, many borrowers owed more than their homes were worth — and had no equity to fall back on. That led to a wave of foreclosures and a housing collapse.
Today, lending guidelines are much stricter. Borrowers are more qualified, and most homeowners have built significant equity in their homes. That equity can act as a financial cushion if unexpected hardships arise.
Rick Sharga, Founder of CJ Patrick Company, puts it this way:
"A significant factor contributing to today’s comparatively low levels of foreclosure activity is that homeowners—including those in foreclosure—possess an unprecedented amount of home equity."
If you’re struggling to keep up with payments, contact your lender. You may have alternatives that weren’t available during the last downturn.
Foreclosure rates may have inched up, but they’re still extremely low when viewed in historical context. The data shows today’s market is not heading toward a crash — and most homeowners are in a much stronger position than they were during the Great Recession.
If you want to understand how today’s market conditions affect your home’s value or buying power, let’s talk. I’ll help you separate facts from fear and guide you through what’s actually happening — not just what the headlines say.