Home-price headlines can point in different directions because they measure different properties, places, and periods. Before using one to set your asking price, check whether it tracks listings, completed sales, or an index of price changes. For a homeowner preparing to sell in Seminole, those broad figures provide context, while comparable local properties help establish a realistic pricing range.
A percentage without its definition can lead you toward the wrong decision. Before reacting to a report, identify:
These details explain many apparent contradictions. A weekly national listing figure and an annual metro sales index can both be accurate while answering different questions. Neither automatically tells you what a buyer would pay for your house.
The July 2026 S&P Cotality Case-Shiller release, published September 29, illustrates the geographic differences. Chicago’s index increased about 6.9% from a year earlier, while Seattle’s declined about 1.6%. Tampa’s metro index was down approximately 0.7% over the same period.
These indexes track single-family home-price changes using repeat sales. They describe metropolitan markets rather than individual municipalities or every type of housing. The Tampa result should not be applied mechanically to a Seminole house, and it does not establish the change for a local condo.

For your sale, narrow the comparison to properties a buyer could reasonably substitute for yours. Size, condition, location, lot characteristics, and major improvements can matter more than whether the broad metro index moved a fraction of a percent.
HousingWire Data’s national median asking-price series moved from approximately $449,000 on August 7 to $435,000 on October 9, 2026. That is a $14,000 difference, or about 3.1%. It describes the midpoint of asking prices in the listing pool, rather than a $14,000 decline in each home’s market value.
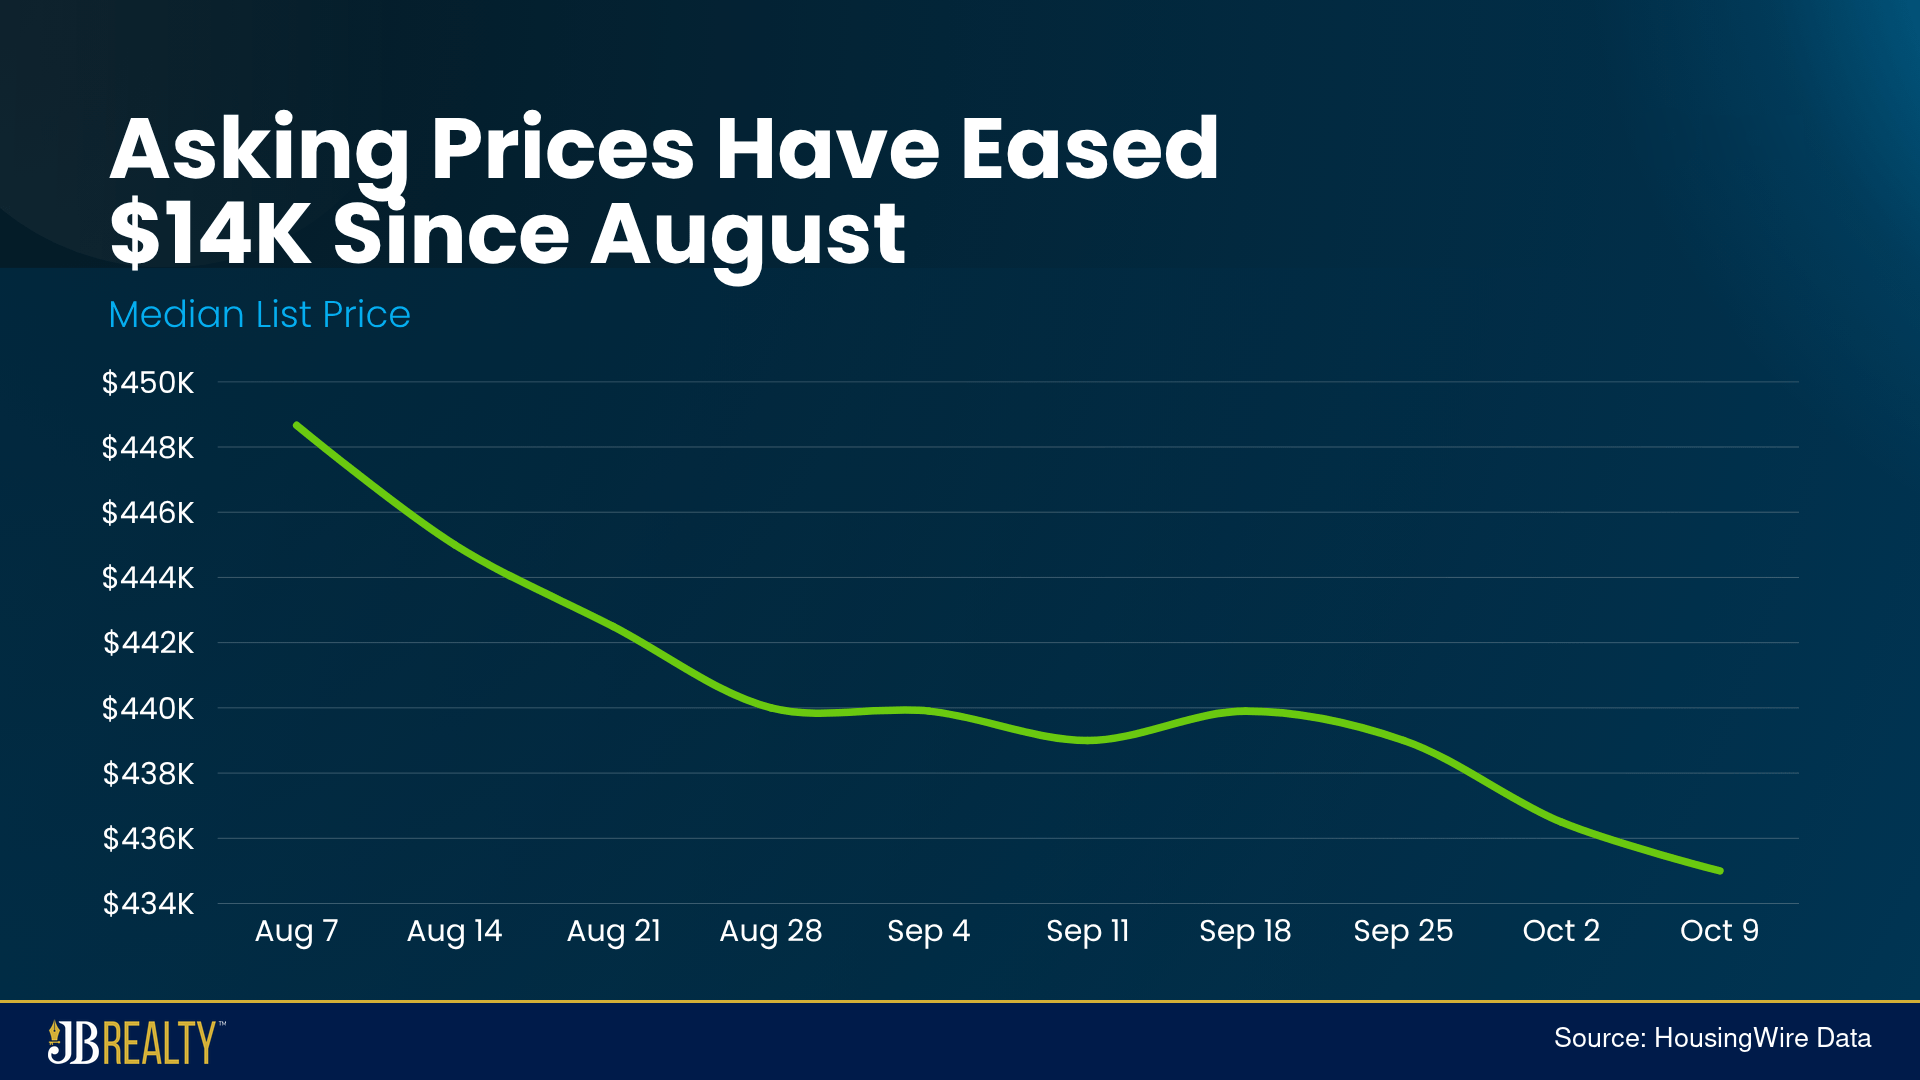
The mix of available properties can move the median even if nobody changes a price. Imagine five hypothetical listings priced at $300,000, $350,000, $400,000, $450,000, and $500,000. Their median is $400,000. Add two listings at $250,000 and $275,000, and the seven-home median becomes $350,000 without any existing seller reducing an asking price.
Actual pricing changes can also move the median. The useful point is that the aggregate number alone does not separate changes in the mix from changes to individual listings. Our explanation of home-price reductions and seller options connects an individual adjustment with current competition and buyer response.
A report released in September may describe July transactions. Completed sales also reflect negotiations that began before closing, so they are evidence of a market that has already operated. Current listings show what sellers are asking now, although those prices have not necessarily attracted an acceptable offer.
Monthly and annual changes can differ without either being wrong. In a hypothetical index, a rise from 100 a year ago to 110 last month, followed by a decline to 108, produces an 8% annual gain alongside a roughly 1.8% monthly decline. The direction depends on the comparison dates.
Seasonal adjustment is another distinction. An adjusted series attempts to account for recurring seasonal patterns; an unadjusted series retains them. Compare like measures before deciding whether a change represents an unusual shift, and avoid assuming every fall decline is entirely seasonal.
The Federal Housing Finance Agency’s Q2 2026 report records approximately 335.7% national growth from Q1 1991 through Q2 2026 in its seasonally adjusted, purchase-only index. Applying that cumulative change to a hypothetical $100,000 starting value produces about $436,000.

That is an index-based illustration, not an appraisal of any particular home bought in 1991. It also measures nominal price growth, meaning it is not adjusted for inflation, and does not deduct ownership or selling expenses. The long-term record includes declines, so it cannot establish that a current local downturn will end quickly or guarantee future appreciation.
Use broad research to understand the setting, then examine recent comparable sales, relevant pending homes, and active competition. Pending listings can show where buyers are committing, but their final sale prices and concessions may remain unavailable until closing.
Check the number of comparable sales as well as their median. A small group can change substantially when one unusually large, renovated, or distressed property sells. Expanding the period or area may provide more evidence, but it also requires accounting for differences.
Finally, compare contract terms alongside price. Seller-paid expenses or repair credits can affect proceeds without appearing in the headline sale price. The goal is a supported pricing range and a plan for evaluating offers, rather than a national percentage applied to your address.
It does not establish that by itself. The median can change because of price adjustments, a different mix of listings, or both. Your home needs a comparison with relevant local properties.
They serve different purposes. Sold prices document completed transactions, while asking prices show the alternatives buyers can consider now. Use both, with attention to timing, condition, and concessions.
The comparison starts on different dates. A recent decline can leave an index above its level a year earlier. Check both periods before describing the overall direction.
Use it as regional context rather than an adjustment formula. The metro covers a broader market, and your property’s type, features, and competition may differ. A local comparison provides a more useful basis for pricing.
Ask us for a review of your home’s likely selling range, including which comparable sales and competing listings support it.